🧭 STA 9750 – Basic Software Tools for Data Analysis (Fall 2025)
Instructor: Prof. Michael Weylandt
Format: Flipped-classroom + experiential learning using R, Quarto, and GitHub
STA 9750 introduces graduate students to data analytics in R through a project-driven format. Instead of traditional exams, students complete a sequence of GitHub-hosted mini-projects and a final capstone project that mirror real-world analytical workflows. Across the semester, assignments emphasize reproducible research, data wrangling, visualization, and clear analytical storytelling using Quarto and GitHub-based collaboration.
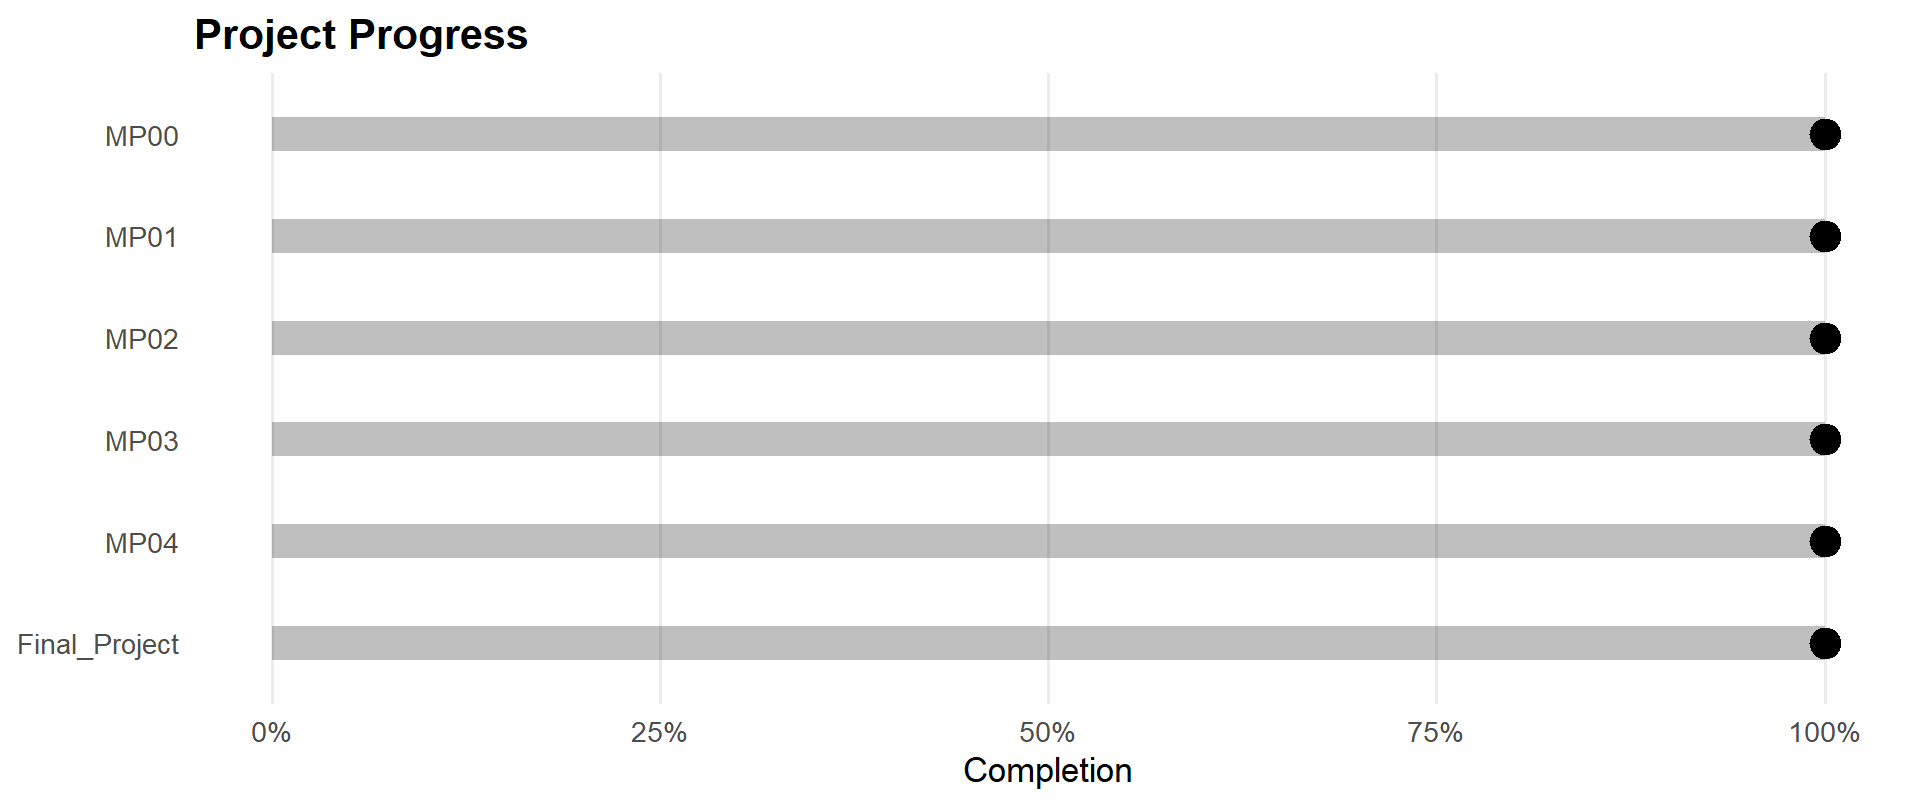
📊 Mini-Projects (MP00 – MP04)
- MP00 – Course Setup: Git/GitHub + Quarto site
- MP01 – Netflix Top 10 Analysis: data wrangling, visualization, and press-style reporting — Open MP01
- MP02 – Housing Affordability Index: ACS + BLS + building permits; index construction and policy visualization — Open MP02
- MP03 – NYC Tree Canopy Analysis: geospatial joins, spatial aggregation, and thematic maps — Open MP03
- MP04 – Just the Fact(-Check)s, Ma’am!: employment revisions and statistical fact-checking — Open MP04
Each mini-project includes a GitHub-based peer review cycle focused on code clarity, reproducibility, and rubric-based feedback.
🌃 Final Project — Nightlife Analytics (NYC)
Research Question:
How does nightlife activity shape urban mobility and safety, and how did COVID-19 change night-time travel behavior in New York City?
This final project examines New York City night-time mobility (8 PM–4 AM) by integrating TLC Yellow Taxi and FHV (Uber/Lyft) trip data with Yelp nightlife venue information.
The analysis compares pre-COVID (2019), COVID (2020), and post-COVID (2023) periods to assess how nightlife-dense and non-nightlife zones experienced uneven collapse and recovery in night-time travel.
The project emphasizes reproducible workflows, zone-level aggregation using DuckDB, and data visualization to support clear interpretation of spatial and temporal patterns in urban night-time activity.
🎯 Learning Objectives
- Develop end-to-end analytical workflows in R / tidyverse
- Produce reproducible Quarto reports integrating code, narrative, and visuals
- Integrate multi-source public data (government, APIs, and web data)
- Apply geospatial analysis and mapping techniques for spatial insights
- Perform exploratory and comparative analysis across time and groups
- Communicate results through clear data storytelling for technical and non-technical audiences
- Practice professional GitHub workflows, including version control and peer review
- Apply responsible AI use and uphold standards of academic integrity
📚 Resources & Policies
- R for Data Science (Wickham & Grolemund), Happy Git with R, Veridical Data Science
- Software: R, RStudio, Quarto (all free)
- AI tools are permitted only for small, targeted coding questions; full assignment generation is prohibited.